Dashboard Screen with Metrics
The dashboard is the first screen you see when you log in to the Kiva Logic software.
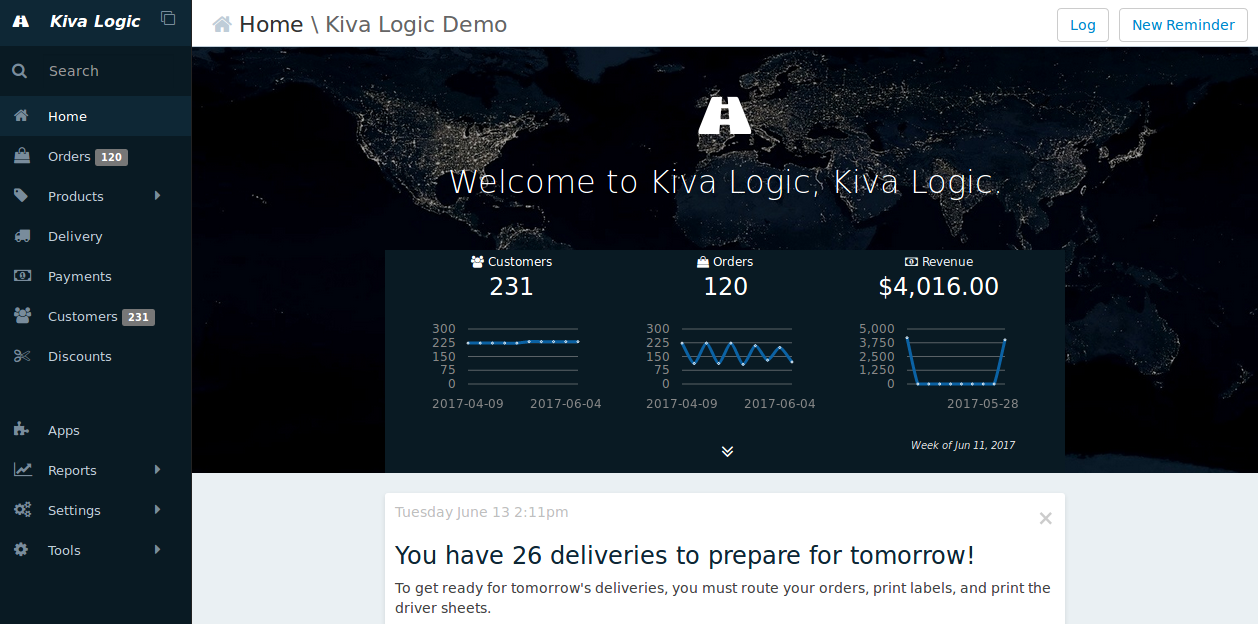
The three main metrics shown on the dashboard are how many active customers you have, how many orders you have for the current week, and what your revenue for the week is. The graphs are quick way to see which direction you are trending for each metric over the past 10 weeks.
Below the graphs, you'll see your message feed. This is where alerts, reminders, updates, and more will show up. If there is something you have to do that day, the system will generate a notice for you. In the above screenshot, the system is telling you that there are deliveries to prep for tomorrow and you need to do routing and download labels.
Help
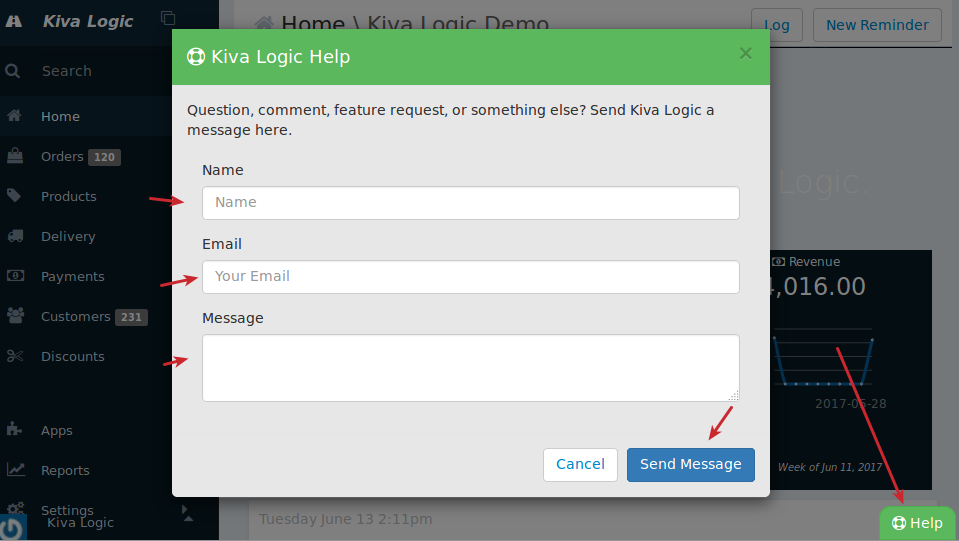
On every screen on the admin side, in the lower right hand side is a button that says 'help'. If you ever have a question, just click that, enter in your message, and it will be sent directly to our customer support. You can also visit this site kivalogic.com/docs/ and use the search function to see if your question has been answered in our docs.
Navigation
The navigation for the admin is on the left hand side. Each of the main menu items will be covered in this Admin Features section. To show sub-navigation options, hover your mouse over the right-pointing arrows (for example, next to Products, Reports, and Settings).
Search
Along with the navigation, there is a search input bar at the top left that you can use on any screen to search for a customer account using a name, email, address, phone, tag, and more.
You can also use the search bar to "instant find" any page on the admin side. Looking for the Addons Report? Just start typing "addo" into the search bar, and you will see the page pop up in the pane to the right.